一、两种类型的动画绘制
第一类: blit=False
根据绘制动画的逻辑,大体分为两类,主要由 matplolib.animation.FuncAnimation 类的 blit 参数确定:
简单来说就是,当使用默认参数时,每一帧都会保留在画布上,与后来绘制的帧混合显示。这时适用于展示长度在改变的数据的变化趋势,例如某一指标的时序数据。或者单纯是希望每张图重叠。主要在于展示纵向的变化趋势。
1
2
3
4
5
6
7
from matplotlib.animation import FuncAnimation
import matplotlib.pyplot as plt
import numpy as np
import os
import time
import imageio
plt.rcParams['font.family'] = ['Microsoft YaHei']
1
2
3
4
5
6
7
8
9
10
11
12
13
14
15
# 定义用于绘制单一帧的函数
def build_frame(n):
    # 确定的数据
    x = np.linspace(-5, 5, 101)
    y = np.sin(x)
    # 改变的长度
    p = plt.plot(x[:n], y[:n], color='blue')

# 将函数与空画布传入 FuncAnimation
fig = plt.figure()
ani = FuncAnimation(fig, build_frame, interval=10)

# 执行 plt.show() 时会自动递增 build_frame 函数中的参数 n
# 并将绘制的每一帧以时间间隔 interval(ms) 逐帧显示
plt.show()
第二类: blit=True
与前者相反,启用 blit 后,每一帧都绘制在单独的空白画布上,然后拼接起来形成动画。这时适用于长度固定但是数据集在改变的趋势,例如改变模型的某个超参数,得到预测值序列的变化趋势。主要在于展示横向的变化趋势。
1
2
3
4
5
6
7
8
9
10
11
def build_frame2(n):
    # 改变的数据
    x = np.linspace(-10, 10, 101)
    y = np.sin(x + n*np.pi/50)
    # 不变的长度
    p = plt.plot(x, y, color='blue')
    # 使用 blit 时,build frame 函数必须显式返回对象
    return p
fig = plt.figure()
ani = FuncAnimation(fig, build_frame2, interval=10, blit=True)
plt.show()
二、更复杂的例子
(1)更多图像设置
微分求导极限过程
1
2
3
4
5
6
7
8
9
10
11
12
13
14
15
16
17
18
19
20
21
22
def derivate(n):
    plt.title('微分法求导 ' + r'$\mathrm{dx}\rightarrow$0')
    plt.xlim(-5, 5)
    plt.ylim(-1.2, 1.2)
    x = np.linspace(-5, 5, n+2)
    y1 = np.sin(x)
    d = 10 / (n+1)
    # 按微分原理求导数:
    y2 = np.array([
        (y1[i+1] - y1[i])/d if i < len(y1)-1 else None
        for i in range(len(y1))
        ])
    p = plt.plot(x, y1, color='blue')
    p += plt.plot(x, y2, 'ro', markersize=2)
    p += plt.plot(x, np.cos(x), color='pink', alpha=0.5)
    plt.legend(p,
        [r'$\mathrm{sin}(x)$', r"$\mathrm{sin^{'}}(x)$", r'$\mathrm{cos}(x)$'],
        loc='upper right')
    return p
fig = plt.figure()
ani = FuncAnimation(fig, derivate, interval=100, blit=True)
plt.show()
动态心形线
1
2
3
4
5
6
7
8
9
10
def heart(n):
    plt.axis('off')
    plt.ylim(-1.6, 2.4)
    x = np.arange(-1.80, 1.80, 0.01)
    y = np.power(np.abs(x), 2/3) + 0.9*np.sqrt(3.3-x**2) * np.sin(int(n)*x*np.pi)
    p = plt.plot(x, y, color='red')
    return p
fig = plt.figure()
ani = FuncAnimation(fig, heart, interval=100, blit=True)
plt.show()

(2)更多图表类型
数据准备
1
2
3
4
5
6
7
8
9
10
11
12
13
14
15
16
import pandas as pd
import tushare as ts
# 五大行股票数据
banks = {'中国银行': '601988', '工商银行': '601398', '建设银行': '601939', '农业银行': '601288', '交通银行': '601328'}
# 使用 tushare 获取
datas = pd.DataFrame()
for k, v in banks.items():
    df = ts.get_hist_data(v)
    drop_list = list(df.columns)
    drop_list.remove('close')
    df.drop(drop_list, axis=1, inplace=True)    # 除收盘价外的列全部删除
    df.rename({'close': k}, axis=1, inplace=True)
    datas = df.join(datas, on='date').dropna()[::-1]    # 合并为一个表
# 转换索引,筛选今年的数据
datas.index = pd.to_datetime(datas.index)
df = datas['2020-01-01': '2020-06-15']
| date | 交通银行 | 农业银行 | 建设银行 | 工商银行 | 中国银行 |
|---|---|---|---|---|---|
| 2020-06-09 00:00:00 | 5.15 | 3.42 | 6.43 | 5.26 | 3.51 |
| 2020-06-10 00:00:00 | 5.13 | 3.4 | 6.4 | 5.27 | 3.5 |
| 2020-06-11 00:00:00 | 5.1 | 3.38 | 6.35 | 5.27 | 3.48 |
| 2020-06-12 00:00:00 | 5.1 | 3.38 | 6.38 | 5.22 | 3.48 |
| 2020-06-15 00:00:00 | 5.07 | 3.33 | 6.27 | 5.24 | 3.44 |
折线图
1
2
3
4
5
6
7
8
9
10
11
12
13
14
15
16
17
18
19
20
21
def ani_line(n, df=datas):
    plt.title('各大银行近年股价变迁')
    plt.xticks(rotation=30)
    plt.ylim(0, 10)
    ax = plt.axes()
    ax.spines['top'].set_visible(False)
    ax.spines['right'].set_visible(False)
    # 绘图时使用注释的代码,保存需要改变legend的显示方式
    # ax.legend(df.columns, loc='upper right')
    colorset = ['#39ad48', '#3b719f', '#ff474c', '#a75e09', '#ffc512']
    if n+1 < len(df):
        for i in range(len(df.columns)):
            # plt.plot(df.iloc[:, i][:n+1], color=colorset[i], linewidth=0.5)
            ln, = ax.plot(df.iloc[:, i][:n+1], color=colorset[i], linewidth=0.5)
            ln.set_label(list(df.columns)[i])
            ax.legend(loc='upper right')
    else:
        plt.plot()
fig = plt.figure()
ani = FuncAnimation(fig, ani_line, interval=1)
plt.show()
条形图
1
2
3
4
5
6
7
8
9
10
11
12
def ani_bar(n, df=datas):
    plt.axvline(np.mean(np.array(df)), color='lightblue')
    plt.xlabel('收盘价(元)')
    plt.xlim(0,10)
    # p = df.iloc[n,:].plot(kind='barh', color='brown', alpha=0.8)
    p = plt.barh(df.columns, df.iloc[n, :], color='brown', alpha=0.8)
    plt.title('各大银行近年股价变迁:' + str(df.index[n])[:10])
fig = plt.figure()
# 这里使用blit会报错,因为条形图和折线图返回的对象是不一样的
ani = FuncAnimation(fig, ani_bar, interval=10)
plt.show()
# 可以看到条形图并不适于可视化这个数据,这里只作为绘图示例
三、动态图保存:重写 save 方法
代码
1
2
3
4
5
6
7
8
9
10
11
12
13
14
15
16
17
18
19
20
21
22
23
24
25
26
27
28
class MyFuncAnimation(FuncAnimation):
    '''Overwrite *FuncAnimation.save* method'''

    def save(self, sample_rate=None, stop_index=None, index=None, quality=None, duration=0.3):

        print('\n> Generating, please wait ...\n')

        if not index:
            length = int((stop_index+1) * sample_rate)
            index = np.linspace(0, stop_index, length).astype(int)

        os.mkdir('./__TEMP__')
        frames = []
        for i in index:
            plt.close()
            self._func(i)
            if not quality:
                plt.savefig(f'./__TEMP__/{i}.jpg')
            else:
                plt.savefig(f'./__TEMP__/{i}.jpg',
                            quality=quality, optimize=True, bbox_inches='tight')
            frames.append(imageio.imread(f'./__TEMP__/{i}.jpg'))

        imageio.mimsave('output.gif', frames, 'GIF', duration=duration)
        time.sleep(1)
        os.system('rd/s/q __TEMP__')

        print('> Saved output.gif')
用法示例
直接使用 MyFuncAnimation 类代替 FuncAnimation 类,除保存外的所有操作同上。具体保存操作参考 MyFuncAnimation.save 源码。以上动图的保存如下:
1
2
3
4
5
6
7
8
9
10
# 第一个图,由于一开始的细节较多,往后的细节较少,可以这样定义index参数:
ani.save(index=[1,2,3,4,6,8,12,16,24,32,48,64,90,100])
# 第二个图,不存在细节的差异,可以取一个周期的长度,并定义采样率
ani.save(0.08, 100, duration=0.08)   # 支持任意精确的浮点数
# 第三
ani.save(index=[1,2,3,4,6,8,12,16,32,64,100, 1000])
# 第四
ani.save(index=[0,15,30,45,50,60,75,90,100], duration=0.3)
# 第五、第六
ani.save(0.02, 600)
四、注意事项
-
本着“能用就行”的原则,并没有进行深入地研究,本文的部分理解和操作可能存在错误,欢迎指正。
-
matplotlib.animation 子模块中用于绘制动画的类或函数还有很多,暂时还没有全部研究。
-
发行版中的 save 函数存在 bug,这里 DIY 了一个可以保存 GIF 的函数。这个函数其实是完全脱离 FuncAnimation 类,与其并非完全兼容,也就是说,plt.show() show 出来的,跟 save 函数保存下来的,不是完全一致的图。根据实际情况进行调整。
-
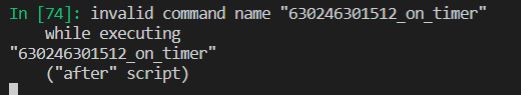
关闭动画窗口后,目测还有残留的进程。此时新建 figure 对象会报错(但是这里并没有返回一个 error,也不知这是什么来的,知道的朋友分享一下),需要使用 plt.close() 强制结束。
-
build_frame 函数好像不能定义结束位置,也就是说 plt.show() 之后它就会不停地一帧一帧地绘图,并且内存会累积起来越来越大。但是官方文档给的例子并没有这种现象。我应该是做错了什么?按理说这种情况应该抛一个 warnings 给我才对,但是并没有。还是“能用就行”,这里暂时不管了,反正内存就是拿来占的。而且 matplotlib 本来就很多 bug…